
Ownership Cost by Vehicle Type: Sedans, SUVs, Trucks, and Minivans Compared
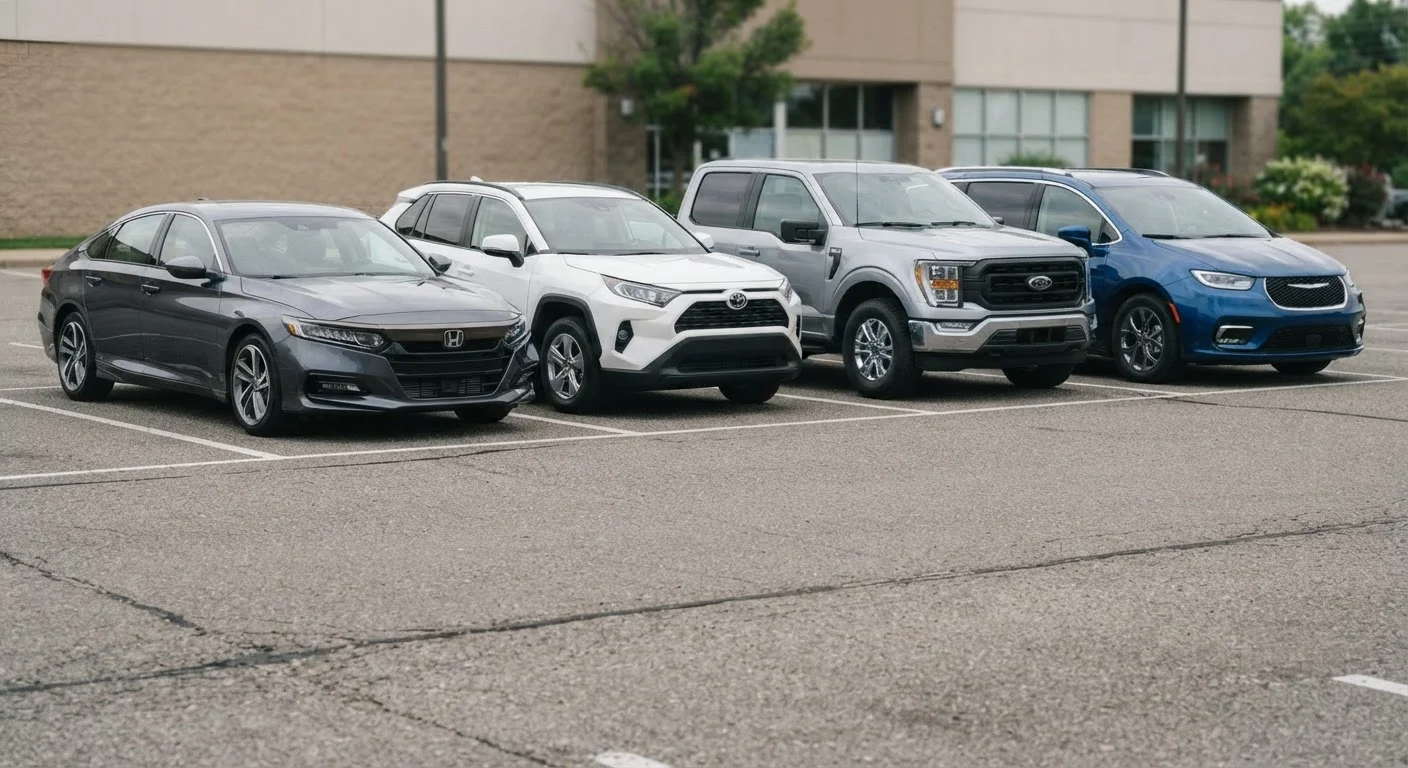
Photo credit: ExplorerGrid.com | Endless Grid Of Factual Content
In this article
- Why Body Style Is a Cost Decision, Not Just a Style Preference
- Fuel: Where the Weight and Size Gap Shows Up Immediately
- Insurance: How Vehicle Category Influences Your Premium
- Tires, Brakes, and Maintenance: The Hidden Weight Penalty
- Depreciation: Where Trucks and Minivans Defy the Norm
- Making the Right Cost-Informed Choice for Your Situation
Body style affects far more than cargo room. See how fuel, insurance, tires, and maintenance costs differ across the most common vehicle categories.
Key Takeaways
- Sedans typically carry the lowest total ownership costs across fuel, insurance, and tires.
- Full-size trucks and large SUVs often cost $1,500–$3,000 more annually to operate than sedans.
- Minivans frequently undercut SUVs on insurance and fuel costs while offering comparable cargo space.
- Tire and brake costs are meaningfully higher on heavier vehicles — a factor many buyers overlook.
- Depreciation rates vary sharply by segment; trucks and minivans tend to hold value better than sedans.
Why Body Style Is a Cost Decision, Not Just a Style Preference
The window sticker captures your purchase price. It tells you almost nothing about what you'll actually spend over five years of ownership. Fuel, insurance, tires, scheduled maintenance, and unscheduled repairs all shift significantly depending on whether you drive a compact sedan or a full-size SUV. Understanding those differences before signing lets you budget realistically rather than absorb surprises later.
For a deeper look at the full ownership cost picture beyond the sticker, see what car ownership actually costs over time. This article focuses specifically on how costs compare across vehicle categories, so you can weigh body style as a financial variable alongside everything else.
Fuel: Where the Weight and Size Gap Shows Up Immediately
Fuel is typically the second-largest annual ownership cost after depreciation, and it's where body style creates the most immediate separation. According to the U.S. Department of Energy's fuel economy data, compact and midsize sedans routinely achieve 30–38 mpg combined in everyday driving, while full-size body-on-frame SUVs and half-ton trucks often fall in the 16–22 mpg range — a gap that can translate to $800–$1,500 in additional annual fuel spend at average US driving distances and typical gas prices.
Midsize crossover SUVs generally land in the middle, averaging 24–30 mpg depending on drivetrain. Minivans — an often-underestimated segment — typically return 22–28 mpg combined, frequently matching or outperforming similarly sized SUVs because their aerodynamic boxy shape is more efficient than it appears and they carry less structural weight than truck-based platforms.
| Sedan | Midsize SUV/Crossover | Full-Size Truck | Minivan | |
|---|---|---|---|---|
| Typical Combined MPG | 30–38 mpg | 24–30 mpg | 16–22 mpg | 22–28 mpg |
| Annual Fuel Cost (est.) | Lower | Moderate | Higher | Moderate-Low |
| Average Insurance Premium | Low–Moderate | Moderate | Moderate–High | Low–Moderate |
| Tire Replacement Cost | $400–$650 | $550–$900 | $800–$1,400 | $500–$850 |
| Depreciation Rate | Moderate–High | Moderate | Low–Moderate | Moderate |
| Scheduled Maintenance Cost | Low | Moderate | Moderate–High | Low–Moderate |
| Cargo & Passenger Capacity | Low | Moderate–High | High (bed) | High |
Opting for front-wheel drive over all-wheel drive on any segment generally improves fuel economy by 1–3 mpg, a detail worth factoring into your real-world cost estimate.
Insurance: How Vehicle Category Influences Your Premium
Insurance premiums are driven by repair cost, theft rates, safety ratings, and the statistical claims history of a given vehicle type — all of which vary across segments. As a general pattern, midsize sedans carry some of the lowest average premiums, while full-size trucks and performance-oriented SUVs tend to cost more to insure.
Minivans consistently score well on insurance costs, partly because their occupant profile (family use, lower mileage on average) correlates with fewer claims. Large SUVs and trucks carry higher repair costs when involved in collisions, which pushes premiums up regardless of the driver's personal record. To understand all the factors shaping your specific rate, see what goes into your car insurance premium.
Annual insurance cost differences between a midsize sedan and a full-size truck can range from a few hundred to over a thousand dollars depending on location, coverage level, and driver history.
Tires, Brakes, and Maintenance: The Hidden Weight Penalty
Heavier vehicles consume tires and brakes faster, and their components simply cost more to replace. A set of four all-season tires for a compact sedan might run $400–$650 installed. The same service on a full-size truck or large SUV — requiring larger, load-rated tires — commonly ranges from $800–$1,400 or more. Brake jobs follow a similar pattern, with larger rotors and calipers adding material and labor costs.
Scheduled maintenance costs are roughly comparable across segments for basic services like oil changes, filters, and spark plugs — though trucks and SUVs with larger-displacement engines often require more oil and may use premium-grade fluids. Minivans, which typically use transversely mounted four- or six-cylinder engines shared with car platforms, often have the most accessible and affordable scheduled maintenance of the larger-capacity segments.
Tracking your recurring ownership costs annually is one of the clearest ways to see how these differences accumulate over a five-year ownership window.
Depreciation: Where Trucks and Minivans Defy the Norm
Depreciation is the single largest ownership cost for most drivers, and it runs counter to the pattern of the other categories. Full-size trucks have historically depreciated more slowly than sedans, with strong residual values supported by sustained commercial and consumer demand. Minivans also hold value reasonably well relative to their purchase price, aided by limited supply and consistent family-buyer demand.
Sedans — especially mid-range models — have faced increasing depreciation pressure as consumer preference has shifted toward crossovers and SUVs. Large luxury SUVs depreciate steeply once outside the warranty period. Midsize crossover SUVs generally land in moderate depreciation territory.
For drivers who plan to sell or trade in within three to five years, depreciation can easily dwarf every other ownership cost combined. Many owners underestimate this cost until the trade-in offer arrives.
Making the Right Cost-Informed Choice for Your Situation
No single vehicle type wins across every cost category. The most cost-efficient choice depends on which costs matter most given your driving patterns, financing situation, and how long you plan to keep the vehicle. A driver commuting 20,000 miles a year will feel fuel costs acutely; a low-mileage driver may weight insurance and depreciation more heavily.
It's also worth examining whether you're actually using the capability you're paying for. A full-size truck rarely used for towing carries all the ongoing costs of that capability with none of the utility benefit. Common assumptions about vehicle costs frequently lead drivers to over-buy on capability and under-plan on ongoing expenses. Reviewing your priorities across each cost category — not just the monthly payment — is the clearest path to a vehicle choice you can sustain financially.

Author
Automotive Editorial Team
Automotive Editorial Team is the collective byline for our editorial team and contributor network. Articles published under this byline or an editorial pen name are researched, written, and reviewed according to our editorial standards for clarity, consistency, and independence before publication.
View all articles →